Automatic active region detection with JSol’Ex 2.9
01 February 2025
Tags: solex jsolex solar astronomy
The latest release of JSol’Ex as of writing this blog post, JSol’Ex 2.9, ships with a new ability: automatically detecting active regions. In this blog post, I will explain the principles and the algorithm I used, but also show its limits.
About active regions
First of all, a bit of vocabulary. An active region is a region of the Sun atmosphere where special activity occurs, such as flares or coronal mass ejections. They don’t have to be associated with sunspots, but in general, they are. In JSol’Ex, we’re essentially detecting sunspots, and the terminology "active regions" essentially comes from the fact that we can use the https://www.swpc.noaa.gov/NOAA database] to label these active regions.
Spectroheliographs
An instrument like Christian Buil’s Sol’Ex, called a spectroheliograph (or SHG in short) doesn’t offer any kind of "live view" like typical solar instruments like Coronado or Lunt instruments. Instead, what we get is a video file, where each frames consists of a "slice" of the sun, observed as a portion of the light spectrum:
The video above is an excerpt from a so-called "scan": the principle is to have a slice of the sun passing through a slit, and a grating is used to spread the light into a spectrum. Here, we are observing a curved dark line, which is the H-alpha line, and the "wobbling" we see around that line is an illustration of the Doppler effect. The idea of software like Valérie Desnoux’s INTI and JSol’Ex is to extract pixels from the studied line (here H-alpha) in order to reconstruct an image of the sun.
However, as you can see in that animation, there’s a lot more information available in each frame. While we are mostly interested in the central line (here H-alpha), it’s also interesting to look "above" or "below" the line, which is often referred to "pixel shifting", in which case we’re not studying H-alpha, but a different wavelength: that’s one of the strenghts of Sol’Ex, which makes it possible to do "science" at home!
In particular, this video shows a couple interesting features:
-
sometimes, you see some vertical dark lines appearing: these are features of the solar atmosphere. The darker lines which spread around multiple columns are these we are mostly interested in for this blog post: they correspond to sunspots!
-
near the end of the video, on the right, you will see a white flash apparearing inside of of these regions: it’s a solar flare!
This video is actually an excerpt from one of the many captures I’ve done with Sol’Ex, and I captured it during an eruption, on May 5th, 2024. What you are seeing here is the massive AR3664 region which was suject to multiple X-flares and resulted in beautiful auroras on Earth!
Automatic active region detection
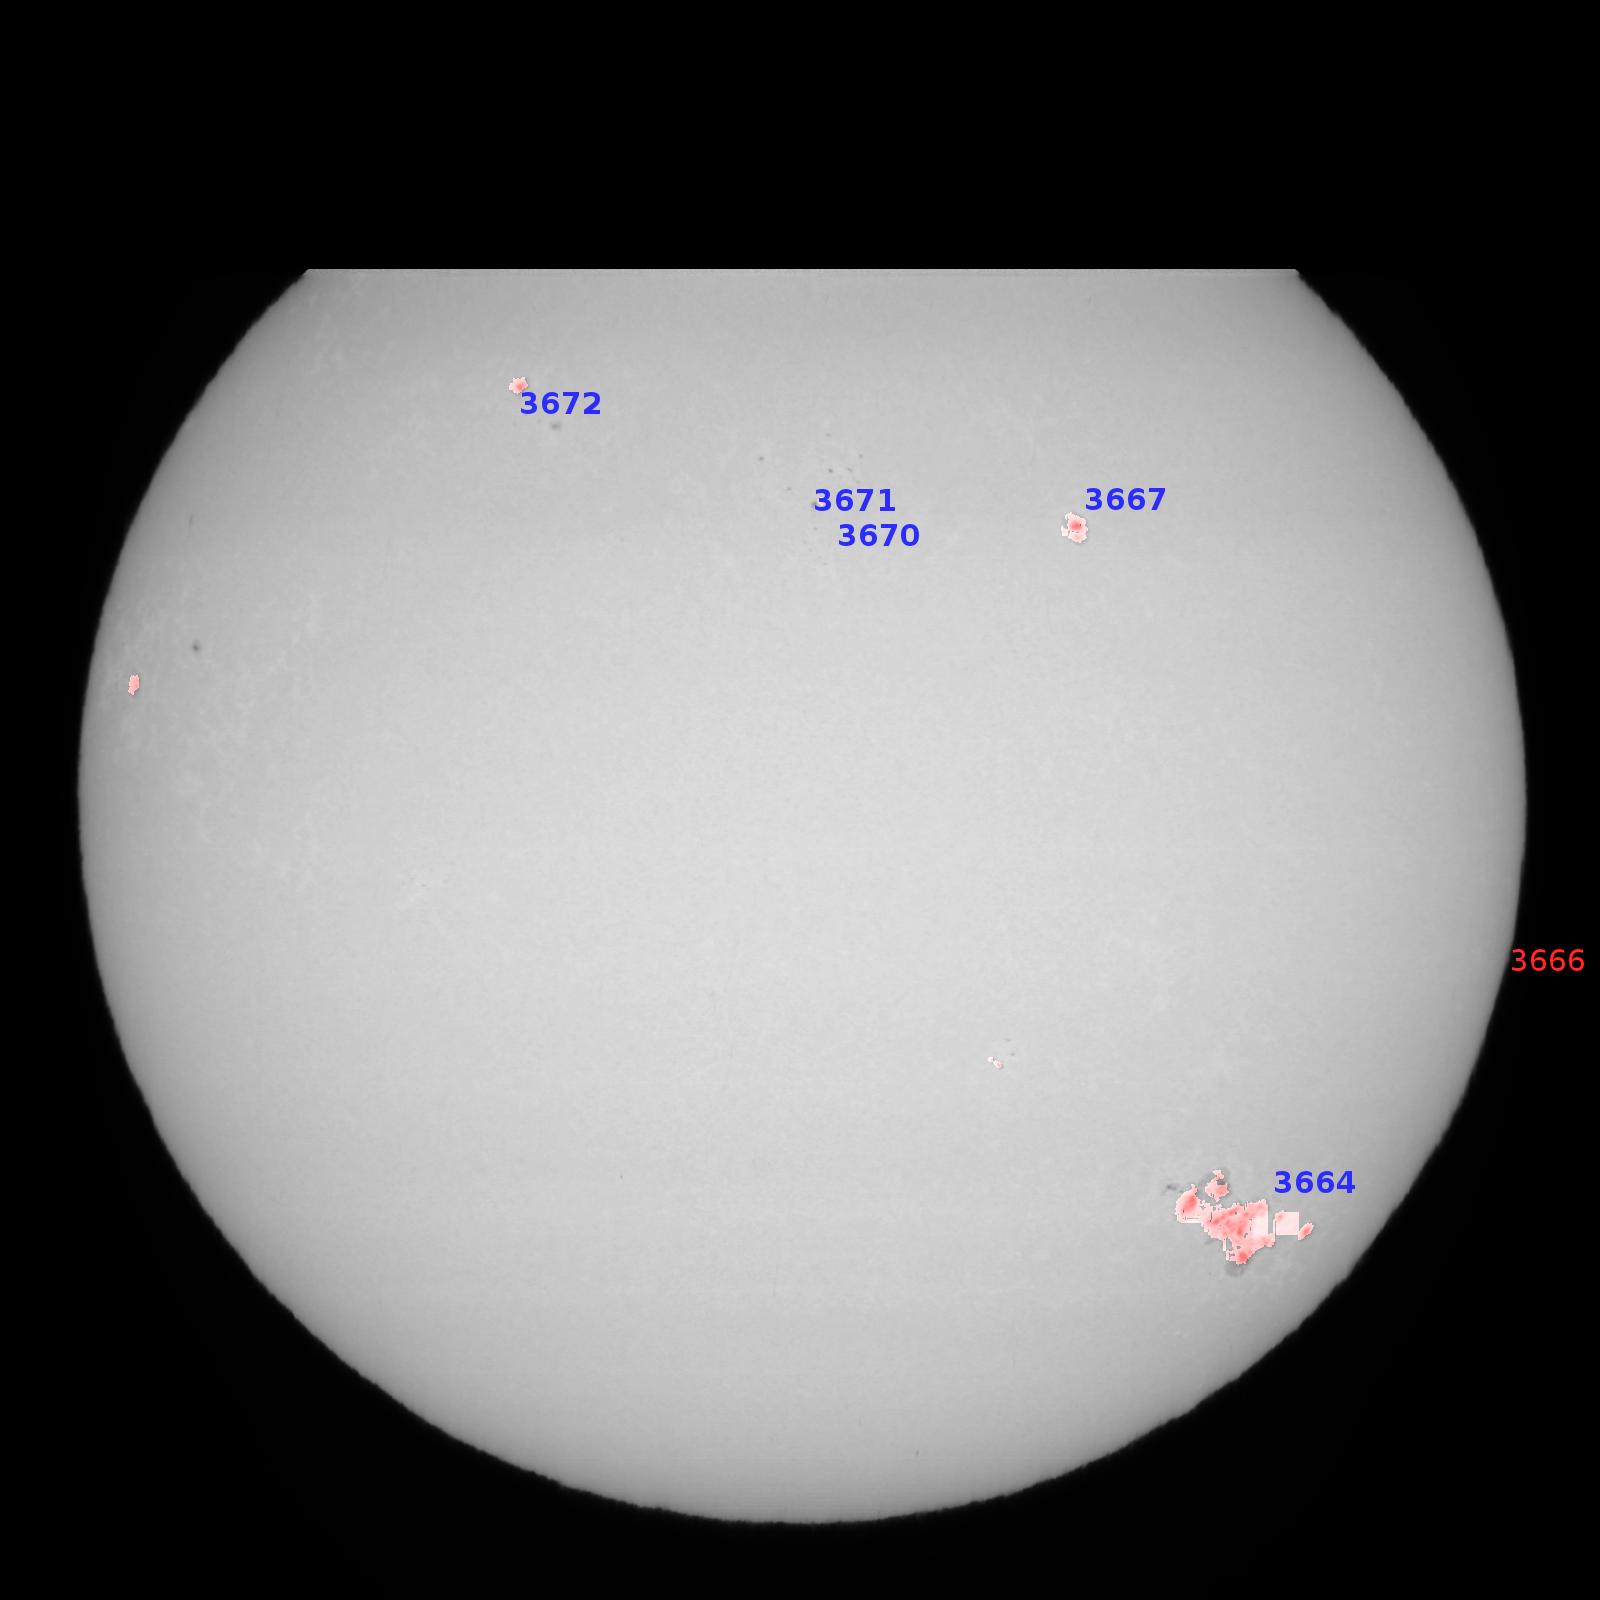
I’ve always considered that it would be a cool feature to be able to detect these lines automatically in JSol’Ex, and provide an overlay of the detected sunspots. Here we go, it is finally implemented in JSol’Ex 2.9.0! If you select the "full processing mode" or that you check the "active regions" checkbox in a custom process, then JSol’Ex will automatically create an image of the sun with the detected active regions as an overlay:
Unfortunately that day I didn’t capture a full disk, but you can see that JSol’Ex annotated the disk with the detected active regions, but it also added the labels for these regions automatically.
Let’s take another example with an image captured in Calcium K on January 17, 2025:
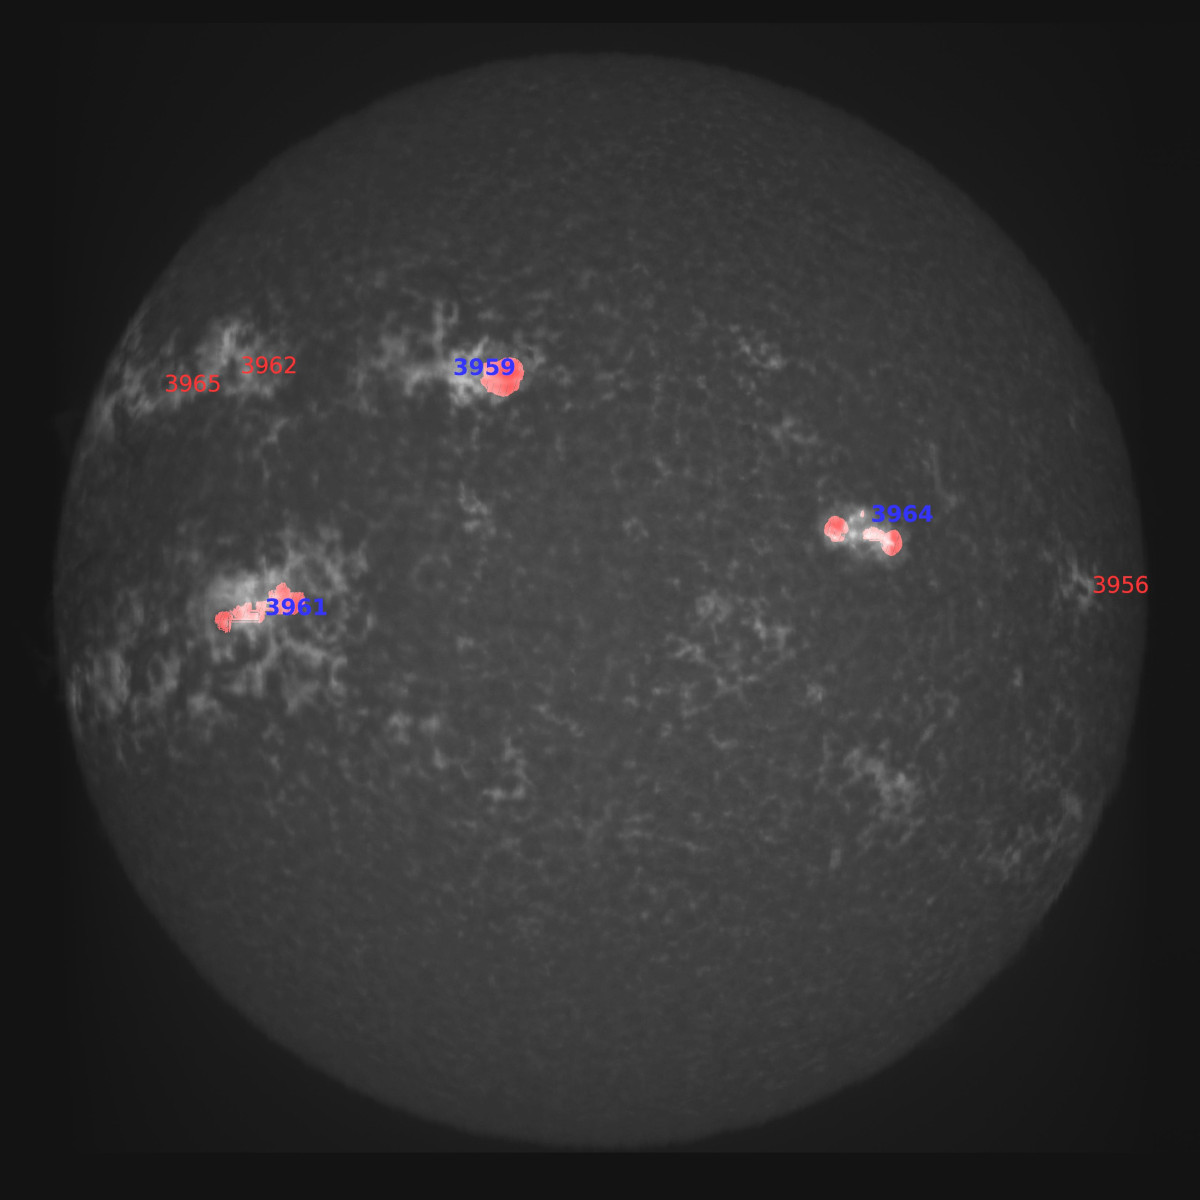
You will notice 2 different colors for labels:
-
blue labels are the ones detected by JSol’Ex
-
red labels are the ones coming from the NOAA database, which were not detected
Sometimes, you will see like in the image above regions which are not detected, and others which are detected but not in the NOAA database. The reason why not all of them are detected is that I had to choose "reasonable" detection thresholds, which work for most use cases. I plan to improve the algorithm over time to make it more robust, based on your feedback.
How does it work?
The algorithm is based on a simple analysis of each frame. If you open your SER file in JSol’Ex video analyzer, you will see something similar to this:
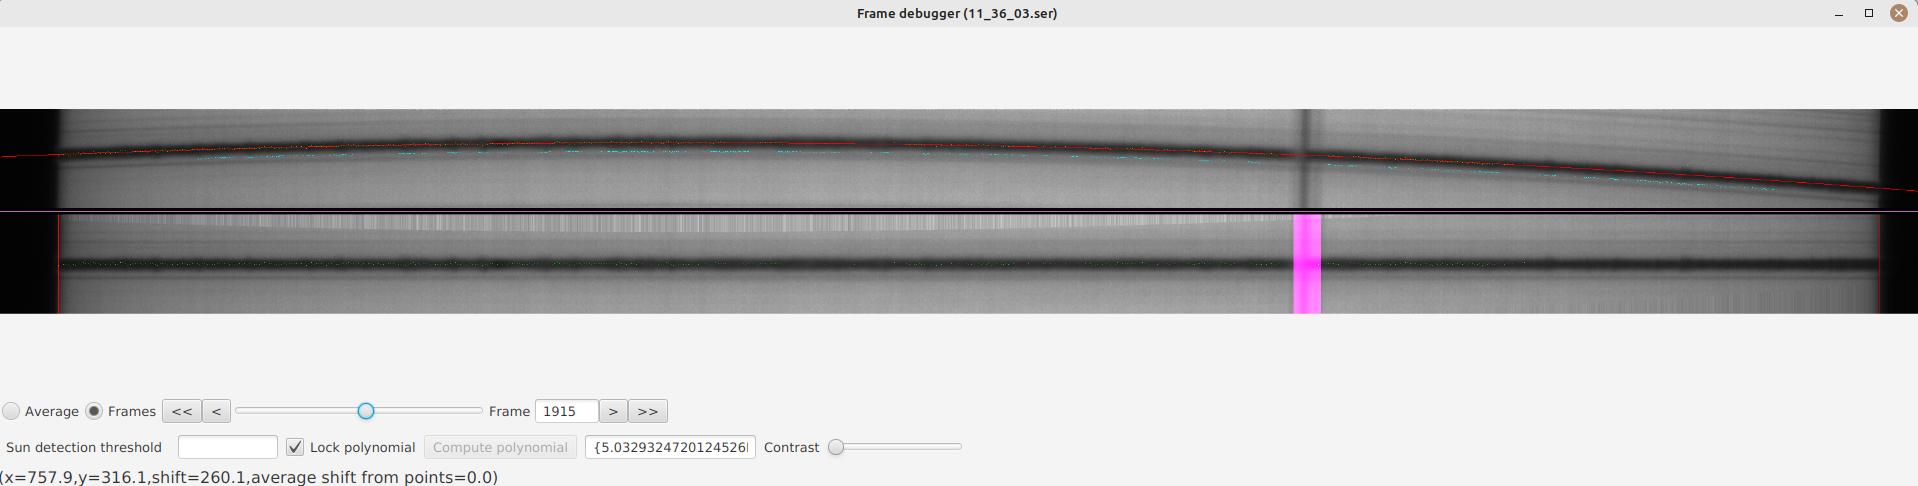
On the top, you see the original frame, with the curved H-alpha line. On the bottom, you see the corrected frame, where the H-alpha line is straightened, and the active regions are highlighted in purple.
The algorithm is based on the following steps:
For each frame:
-
Detect the borders of the sun
-
For each column, compute the average intensity of the column, as well as its standard deviation
-
Compute a 3rd order polynomial fit of the average intensity and standard deviation
-
now, for each column, we compare its average intensity and standard deviation to the polynomial fits: if both of them are below a particular threshold, we consider that we have detected a candidate
The reason to only keep candidates which have both average intensity and standard deviation below a threshold is because:
-
sunspots characterize by a clear vertical line, which means that the standard deviation is low (most pixels have a similar value on the column)
-
sunspots are darker than the surrounding, which means that the average intensity is lower
At the moment, I’m using the following thresholds (note that they may change in future releases, as I improve the accuracy):
-
average intensity threshold: 0.95 times the predicted value
-
standard deviation threshold: 0.85 times the predicted value
Once we have the results for all frames, we aggregate active regions by collecting adjacent candidates.
Finally, we filter out regions which are too small, then perform clustering of regions which are close to each other.
The whole algorithm can be found here (note that it also includes redshift detection, which was discussed in a different blog post).
Limitations
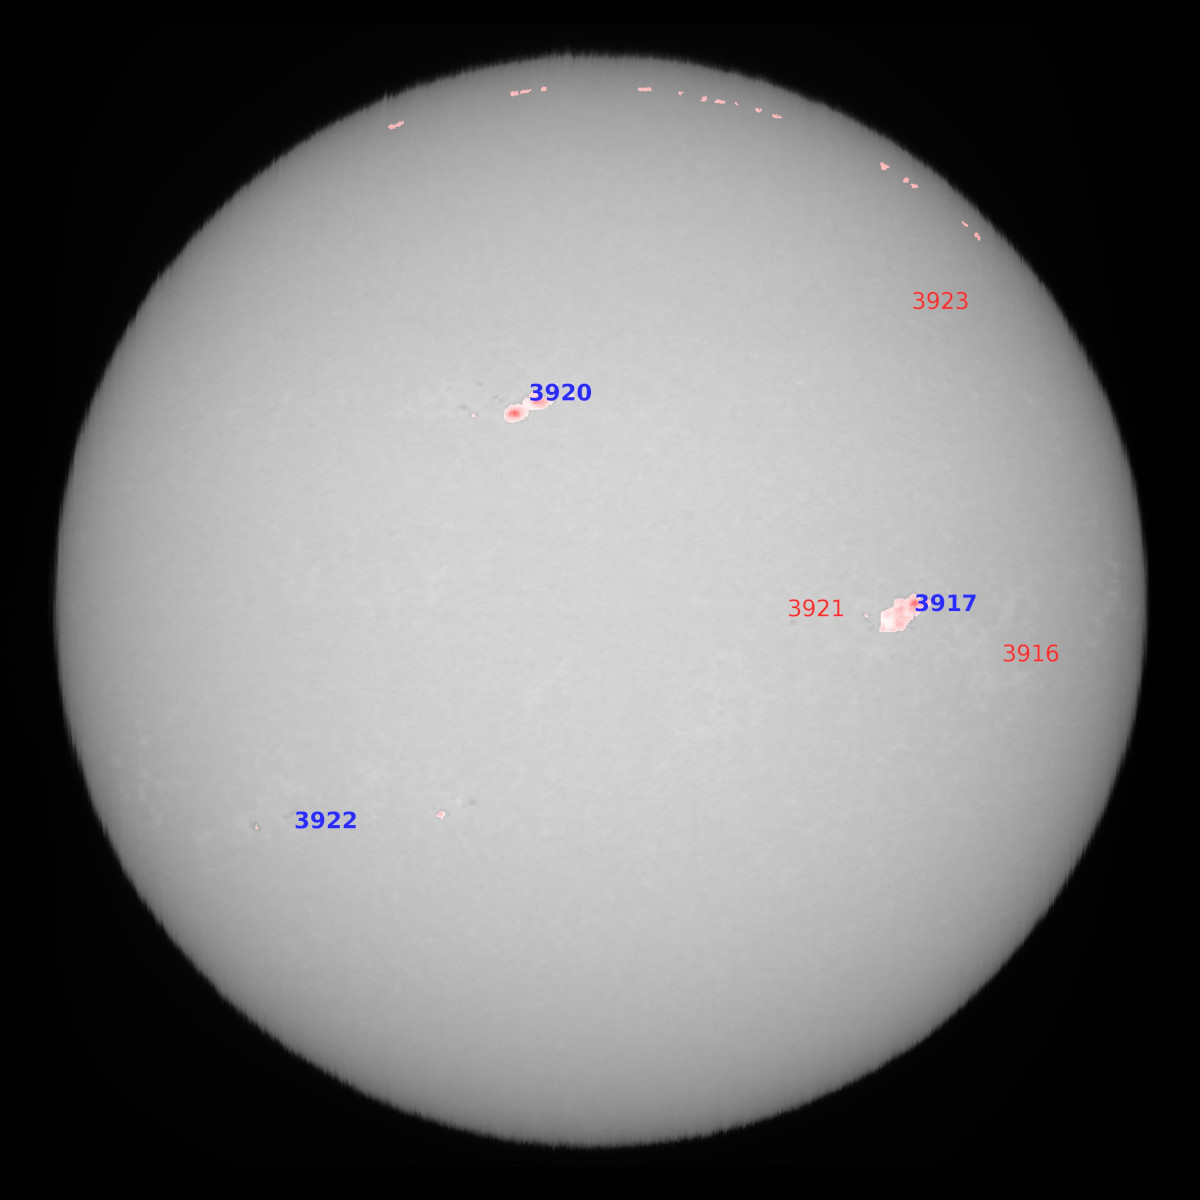
This algorithm proves to work relatively well in many different wavelengths (H-alpha, calcium, magnesium …). However, there are sometimes false positives. This is for example the case when I’m scanning in H-beta, due to the long focal length of my telescope and astigmatism, and the fact that H-beta provides a lot of details.
In this case, the algorithm detects areas which are actually just noise:
Note that these are close to the north and south poles. I have also noticed that the algorithm tends to detect noise as active regions when we’re close to the limb, which is also why I’m currently filtering these out.
At this stage, I have chosen not to make the detection thresholds configurable, because I consider these internal implementation details, which may change in the future, and that I don’t want to expose to the user.
Annotation of active regions
Once piece of work that we didn’t explain yet is how JSol’Ex puts labels around active regions. For this, we are using the NOAA Solar Region Summary database.
This provides us, at a particular date, the list of active regions with their positions on the solar disk. JSol’Ex will compare these with the detected regions, and put the labels in different colors based on whether they were detected or not.
However, the position of active regions will only be correct if:
-
you have properly oriented your image (north at the top, east on the left): to help you with this, use the "GONG" tab on the right of the interface to download a reference image and compare with yours
-
you are using an equatorial mount. If you are not, then make sure to check the new "alt-az" mode and enter your GPS coordinates in the settings, so that JSol’Ex can compute the parallactic angle of the sun at the moment of the observation and automatically correct the orientation of the image.
The data from NOAA is cached in your local filesystem, so that we don’t have to download it every time you open a video file.
Frequently Asked Questions
Despite only having released this a day ago, I already have received the same question multiple times: can JSol’Ex be used to annotate an existing image of the sun, that is to say, take a JPG or PNG image and annotate it?
If you have read carefully this blog post and that I explained things correctly, you will have understood that the answer is no: because my algorithm is based on the analysis of each frame, there’s no such information available in a single image.
Conclusion
I hope you will enjoy this new feature in JSol’Ex 2.9.0. This blog post is a tentative explanation of the algorithm, and I will be happy to answer any questions you may have about it. As always, feel free to contribute, JSol’Ex is open source!
